MD20#
The MD20 is a compact brushless motor controller, ideal for small, precise gimbal motors. It offers multiple control modes, including position PID, velocity PID, impedance, raw torque, profile position, and profile velocity. The MD20 also supports easy daisy-chaining, allowing seamless integration of multiple controllers in a single control network.
General parameters#
Parameter |
Value |
|---|---|
Nominal Input Voltage Range |
24 - 42 VDC |
Maximum Input Voltage Range |
10 - 48 VDC |
Max Input Current |
3.1 A |
Max Continuous Phase Current w/o cooling |
4.5 A |
Max Peak Phase Current (t = 2 s) |
20 A |
Built-in software-controlled termination resistor |
optional |
FDCAN Baudrate (adjustable) |
1/2/5/8 Mbps |
Position PID Controller Execution Frequency |
1 kHz |
Velocity PID Controller Execution Frequency |
5 kHz |
Impedance Controller Execution Frequency |
40 kHz |
Torque Control Execution Frequency |
40 kHz |
Torque Bandwidth (adjustable) |
50 Hz - 2.5 kHz |
External encoder connector (SPI, RS422) |
yes |
External 5V power supply max current |
150 mA |
Important
The MD20 is equipped with a custom shunt resistor suited for more precise current sensing. As a result all the configuration files (.cfg) dedicated for MD20 MUST contain [hardware] section with shunt resistance parameter equal to 0.004, ie.:
[hardware]
shunt resistance = 0.004
Mechanical data#

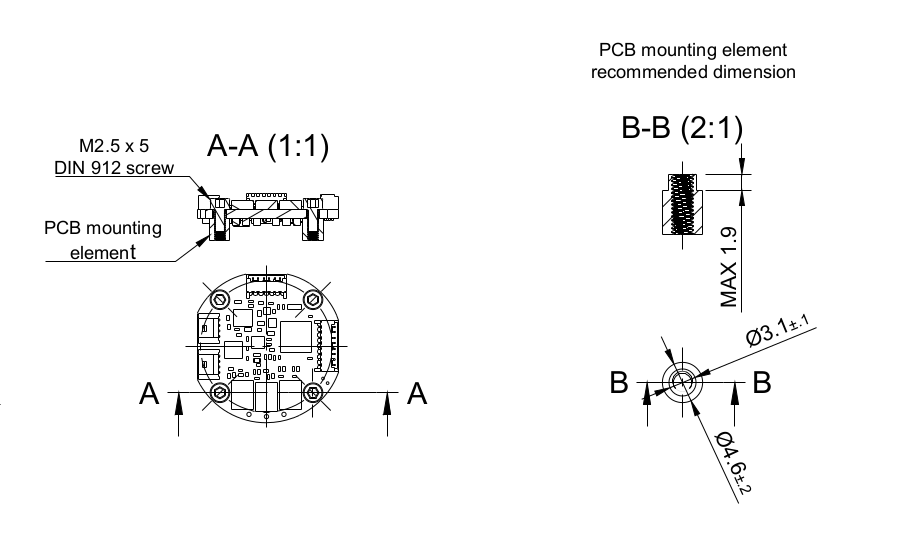
Connectors pinout#
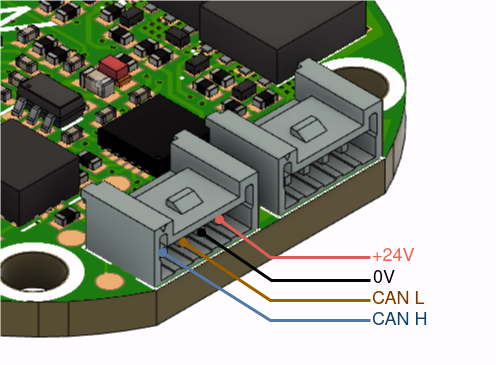
For power supply and CAN bus connection two 2200980471 Molex Micro-lock connectors are available. They act as an internal bridge for easy chaining of the drives.
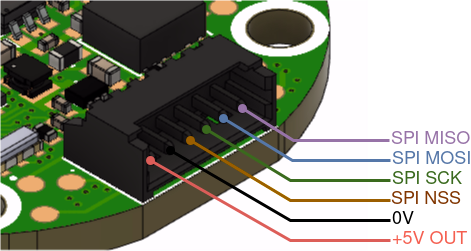
For external encoder connection via the SPI 530480650 Molex PicoBlade connectors is provided.
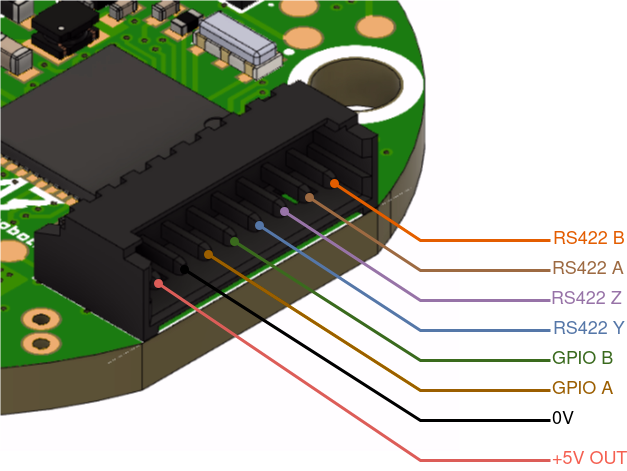
For external encoder connection via the RS422 and the GPIO pins utilization 530480810 Molex PicoBlade connectors could be used.
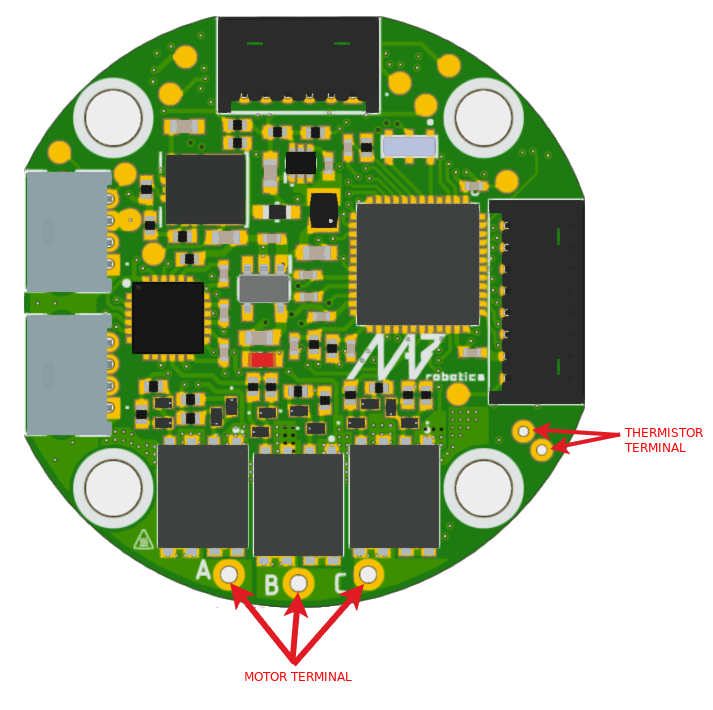
Note
For the current version of the board we recommend using NTCMHP10K thermistors. Using other thermistors may result in imprecise temperature readout.
Thermal specification#
Thermal performance and efficiency
MD20 is a tiny but high-power, highly integrated motor controller. It creates challenges related to heat management and thermal performance. Taking this in mind, the design of the PCB is 6 layers to achieve excellent performance even without any cooling. The used components include small and efficient power converters and MOSFETs with best-in-class FOM(figure of merit).
The motor controller is only a part of the actuator, so we have done tests in the worst scenarios in a real setup, to provide valuable and relevant information about performance in the assembled actuator, instead of the idealized or simulated one.
Power losses and system efficiency
To understand the charts below, we need to distinguish between mechanical power efficiency and electrical power conversion efficiency.
Mechanical power is the torque exerted by the motor (𝛕) multiplied by the angular velocity (𝝎) of the shaft. If the shaft is locked in place, the mechanical power will be zero, and thus, the mechanical power efficiency will also be zero in that scenario.
Electrical power conversion can be explained as the ratio between the power delivered to the electric motor and the total electric power consumed by the system. In this case, even though the motor’s mechanical power is zero, the efficiency of the driver can still be greater than zero due to the conversion of power to heat within the motor.
The scenario where mechanical power is zero is the worst-case scenario for electrical power conversion efficiency. In this case, all of the energy gets converted into heat.

As can be seen in the figure, the measured IQ is equal to the Ic current because the motor shaft was blocked.
Ia, Ib, and Ic are motor phase currents, and Iq is the virtual quantity, which can be understood as the current in an old-fashioned brushed motor. Two quantities are important to analyze the inverter efficiency and losses: input power to the motor controller and the energy transferred from the inverter to the motor windings. Those quantities are the base that tells almost everything about the influence of the motor controller on the actuator system performance. There is only one exception connected to the inverter efficiency and the whole system efficiency - its switching frequency. Tuning this parameter can increase the torque generated from the motor phase current by reducing phase currents THD, but also increase switching losses. Detailed analysis of these effects is out of the scope of the documentation, as it is motor-dependent on the system level. The gearbox/torque transfer efficiency as well.
Returning to the inverter, various losses are mainly related to transistor conduction and switching. Keeping as the rule to avoid theory and mathematical models, for the MD20 motor controller, which has a switching frequency of 40 kHz, at 24VDC supply total losses were measured the way described below.
The motor driver was supplied by the SIGLENT SPS5000X Digital power supply. Measurements of input Current, Voltage, and Power consumed by the whole setup were taken from this device. The power of the motor itself was calculated using discrete data of currents and voltages in each phase measured by the MD20 in each FOC cycle to ensure sampling at the same frequency as the control loop.

at various currents are collected in the table below:
| Input current[A] | Input power[W] | Respective peak phase current [ A ] |
Output power[W] | Losses[W] | Efficiency[%] |
| 0,05 | 1,25 | 1 | 0,63 | 0,62 | 50,40% |
| 0,10 | 2,34 | 2 | 1,92 | 0,42 | 82,05% |
| 0,17 | 4,12 | 3 | 3,79 | 0,33 | 91,99% |
| 0,29 | 7,06 | 4 | 6,58 | 0,48 | 93,20% |
| 0,47 | 11,35 | 5 | 10,6 | 0,75 | 93,39% |
| 0,70 | 16,87 | 6 | 15,6 | 1,27 | 92,47% |
| 1,05 | 25,17 | 7 | 23,2 | 1,97 | 92,17% |
| 1,46 | 35,1 | 8 | 32 | 3,1 | 91,17% |
During the analysis the idle power consumption of the board came out to be about 0,5W.
Because the input data for the table was taken when all parameters became stable ( due to the temperature interia ) we were not able to measure phase currents over 8A because the motor
was overheated.
Input power was measured by the digital power source Siglent SPS5000X. The output power was computed based on the phase voltages and currents measured with the oscilloscope. Losses were computed as the difference between input and output power.
The table above shows the losses. The tests described below present how the MD20 handles it.
Thermal tests
To cover all potential cases, three cooling scenarios have been performed:
No additional cooling
Passive cooling
Active air cooling
In each test, the MD20 motor driver was coupled with the MN4004-21 BLDC Motor.
MN4004-21 Motor parameters:

To maximize the convection effect and thus simulate the “worst case” of the setup position, the motor was mounted horizontally, under the MD20 so the heat dissipated by the motor additionally heats the driver PCB. We did our best to provide usable and relevant data about the performance.
To ensure constant DC current in the motor phases, its shaft was blocked and the control loop was tweaked so that the current was equally distributed to each phase of the motor.
In each scenario, the tests were repeated for various cases of phase currents. from 0,5A to 5A with the step of 0,5A, and from 5A to the maximum current (that does not overheat the driver) with the step of 1A. For each current, the setup was tested until the temperature reached a stable value.
All tests were performed in constant environment conditions, in still air at 25 C ambient temperature.
Before each particular test, the device was powered on and preheated itself to the idle temperature of about 39°C.
MD20 Temperature was measured with the usage of an onboard thermistor placed on the bottom layer of the PCB, directly below the MOSFETs.

Test scenario I - no additional cooling.


Temperature vs Time characteristic:

Summary table:
| No cooling thermal test summary | ||
| Maximum continuous current |
4,5A | |
| Current | Stable temperature | Time to reach |
| 1A | 46°C | ~ 1250 s |
| 1,5A | 51°C | |
| 2A | 56°C | |
| 2,5A | 62°C | |
| 3A | 68°C | |
| 3,5A | 78°C | |
| 4A | 83°C | |
| 4,5A | 92°C | |
| 5A | 100°C | ~ 980 s |
| 6A | 100°C | ~ 440 s |
| 7A | 100°C | ~ 250 s |
| 8A | 100°C | ~ 120 s |
| 9A | 100°C | ~ 95 s |
| 10A | 100°C | ~ 70 s |
Test scenario II - passive cooling.


Temperature vs Time characteristic:

Summary table:
| Passive cooling thermal test summary | ||
| Maximum continuous current |
5A | |
| Current | Stable temperature | Time to reach |
| 1 A | 46,5°C | ~ 2100 s |
| 1,5A | 48,2°C | ~ 2100 s |
| 2A | 53.8°C | ~ 2000 s |
| 2,5A | 59,5°C | ~ 2000 s |
| 3A | 66,3 °C | ~ 2000 s |
| 3,5A | 72,1°C | ~ 2800 s |
| 4A | 79,7°C | ~ 2600 s |
| 4,5A | 88,9°C | ~ 2600 s |
| 5A | 95,1°C | ~ 1850 s |
| 6A | 100°C | ~ 800 s |
| 7A | 100°C | ~ 480 s |
| 8A | 100°C | ~ 325 s |
Note
During the tests in this scenario, the motor windings were getting warmer much faster than the MD20 PCB so the tests were stopped after 8A to avoid damaging the motor. The motor started to produce smoke before the motor controller reached 100 degrees C, so the test was finished on the 8A.
Test scenario III - active cooling


Temperature vs Time characteristic (note that this characteristic was splitted into two current ranges):


Summary table:
| Active cooling thermal test summary | ||
| Maximum continuous current |
13A | |
| Current | Stable temperature | Time to reach |
| 1 A | 33,2°C | ~ 170 s |
| 1,5 A | 33,6°C | ~ 170 s |
| 2 A | 34°C | ~ 180 s |
| 2,5 A | 34,6°C | ~ 180 s |
| 3 A | 35,4 °C | ~ 180 s |
| 3,5 A | 36,4 °C | ~ 180 s |
| 4 A | 37,3 °C | ~ 180 s |
| 4,5 A | 38,5 °C | ~ 200 s |
| 5 A | 40°C | ~ 230 s |
| 6 A | 43,5°C | ~ 400 s |
| 7 A | 47,5°C | ~ 490 s |
| 8 A | 51,5°C | ~ 580 s |
| 9 A | 58,5°C | ~ 630 s |
| 10 A | 73°C | ~ 430 s |
| 11 A | 78°C | ~ 420 s |
| 12 A | 84,9°C | ~ 540 s |
| 13 A | 94,9°C | ~ 540 s |
| 14 A | 100°C | ~ 280 s |
